Grow Creator Field Notes
Small YouTube channel statistics: 360 real channels
Reference numbers for channels between 1K and 75K subscribers, measured from 360 real channels rather than borrowed. Full method and limits published.
Most published "small channel" benchmarks are borrowed. The pages ranking for them cite each other, or cite one analysis of a different population, and none shows the underlying channels. These numbers come from 360 real YouTube channels between 1,030 and 75,200 subscribers that we audited, and every figure is re-derivable from the script named at the bottom.
Read the limits section before you quote anything here. It matters more than the tables.
What a channel this size actually looks like
The 360 channels break down like this:
| Subscribers | Channels | Share |
|---|---|---|
| 1K to 5K | 137 | 38.1% |
| 5K to 10K | 60 | 16.7% |
| 10K to 25K | 97 | 26.9% |
| 25K to 50K | 62 | 17.2% |
| 50K and up | 4 | 1.1% |
The top band holds four channels. That is not enough to report a benchmark from, so we have left it out of everything below rather than dress up a sample of four as a finding.
Views per video by subscriber band
This is the number people come looking for. Median lifetime views per upload:
| Subscribers | Channels | Median views per video |
|---|---|---|
| 1K to 5K | 137 | 1,260 |
| 5K to 10K | 60 | 2,209 |
| 10K to 25K | 97 | 8,219 |
| 25K to 50K | 62 | 12,864 |
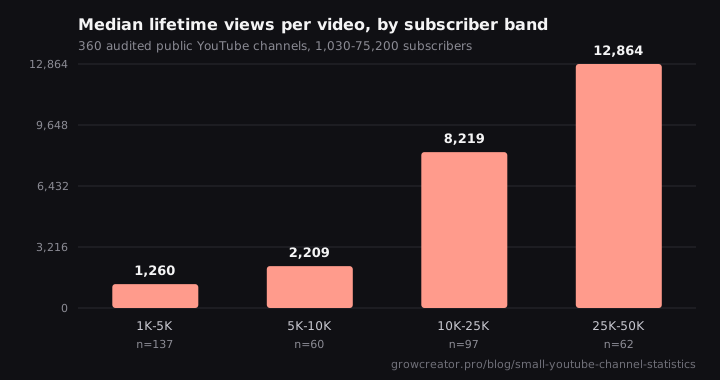
Note what happens across those rows. Subscribers roughly multiply by ten from the first band to the fourth, while median views per video multiply by about ten as well, but the jump is not smooth: the step from 5K-10K to 10K-25K is nearly four times, far steeper than the step before it. Whatever changes around ten thousand subscribers changes reach more than it changes audience size.
The spread is the real finding
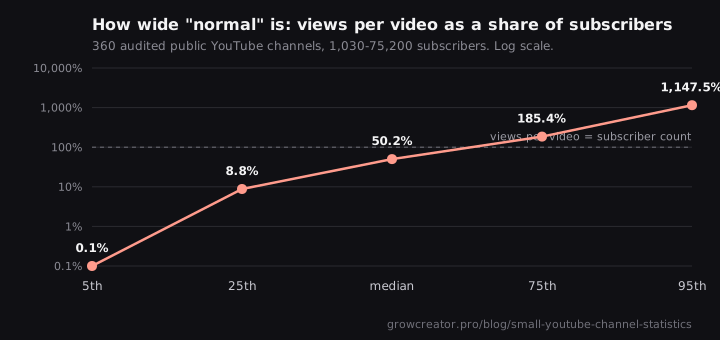
A median hides how wide the range is. Expressed as views per video divided by subscriber count, across all 360:
| Percentile | Views per video, as a share of subscribers |
|---|---|
| 5th | 0.1% |
| 25th | 8.8% |
| 50th | 50.2% |
| 75th | 185.4% |
| 95th | 1,147.5% |
That is roughly four orders of magnitude between the bottom and the top of the same population. Two channels with 10,000 subscribers can sit at either end of it.
This is why the tidy "healthy ratio" bands published elsewhere do not survive contact with real channels. The 5 to 20% band that the top-ranking page calls healthy contains 15.6% of these channels. The 8 to 14% figure that several pages converge on contains 6.4%. And 63.3% sit above 20%, the band those same pages reserve for excellent. We took that apart properly in views to subscriber ratio: what 360 channels show.
Back catalogue size
How many videos these channels have published in total:
| Percentile | Uploads |
|---|---|
| 10th | 72 |
| 25th | 180 |
| 50th | 392 |
| 75th | 787 |
| 90th | 1,500 |
By band, the interquartile range of catalogue size:
| Subscribers | Median uploads | Middle 50% |
|---|---|---|
| 1K to 5K | 326 | 160 to 709 |
| 5K to 10K | 546 | 186 to 1,100 |
| 10K to 25K | 463 | 196 to 770 |
| 25K to 50K | 351 | 156 to 787 |
One caution, because this table invites a conclusion it cannot support. Catalogue size does not climb with subscriber count here, and it would be easy to read that as evidence that publishing more does not help. It is not. This is a cross-sectional snapshot with no channel-age field, so upload count mostly reflects how long a channel has existed rather than how often it posts. The study that measures the right variable is vidIQ's, across more than ten million channels, comparing average monthly uploads over a fixed window against monthly growth rate, and it finds higher cadence tracking faster growth. Nothing here contradicts that, and we are not going to let a table imply otherwise.
Where these channels are
| Country | Channels | Share |
|---|---|---|
| India | 150 | 41.7% |
| United States | 66 | 18.3% |
| Not set | 61 | 16.9% |
| Canada | 8 | 2.2% |
| Japan | 8 | 2.2% |
Worth stating because it shapes everything above. This is not a global sample. It skews heavily toward India, and a sixth of the channels do not publish a country at all. If you are benchmarking a US-only channel against these medians, that is a real caveat rather than a formality.
How to use these numbers
Treat them as a reference point for the question "is this in the normal range", never as a target.
- Find your band, then look at the spread, not the median. With a 25th percentile at 8.8% of subscriber count and a 75th at 185%, being under the median means very little on its own.
- Compare your last ten uploads, not your lifetime average. Every figure here is lifetime, which is dominated by whatever a channel was doing years ago.
- If your recent videos all land in a narrow band, that is a ceiling, not a quality problem. Different diagnosis, different fix. We covered the pattern in Shorts view jail.
- If one video carries most of your views, your median is meaningless. Hit-driven channels need to be read differently from consistent ones.
Method, and what these numbers cannot tell you
The corpus is 360 public YouTube channels captured through the public YouTube Data API: subscriber count, video count, lifetime view count and country. No private data, no logged-in analytics, nothing from anyone's Studio account. Every figure above is produced by scripts/analyzeAuditCorpus.ts in our repository, so it can be re-derived rather than taken on trust.
The limits, stated plainly:
- Selection bias. These channels were run through a Grow Creator audit. They are not a random sample of YouTube, and creators who go looking for an audit may skew toward those who feel stuck.
- Lifetime averages. Views per video is total views over total uploads. It cannot predict your next upload, and it penalises long back catalogues mechanically.
- No channel age. Which is why nothing here supports any claim about posting frequency.
- Rounded subscriber counts. YouTube publishes 4.2K, not 4,231, so every band edge is approximate.
- Skewed geography. India is 41.7% of the sample.
- The 50K+ band has four channels and is excluded from every table except the population breakdown.
None of that undermines the central point, because the central point is about spread rather than about any single number: across channels of the same size, normal covers a range so wide that a single benchmark cannot be meaningful.
Use these charts
You may republish either chart above, or any figure on this page, anywhere you like. The only thing asked in return is a visible credit linking back to this page, so a reader can check the method and the sample for themselves. That is the whole licence.
Copy this to embed the band chart with the credit already attached:
<figure>
  <img src="https://growcreator.pro/charts/views-per-video-by-band.svg"
       alt="Median lifetime views per video by subscriber band, 360 audited YouTube channels"
       width="720" height="380" loading="lazy">
  <figcaption>
    Median lifetime views per video by subscriber band, from
    <a href="https://growcreator.pro/blog/small-youtube-channel-statistics">360 audited public YouTube channels</a>
    (Grow Creator, 2026)
  </figcaption>
</figure>
Or the spread chart, which is the one worth using if your point is that a single benchmark does not describe a channel:
<figure>
  <img src="https://growcreator.pro/charts/views-per-video-spread.svg"
       alt="Views per video as a share of subscriber count across 360 audited YouTube channels, 5th to 95th percentile"
       width="720" height="340" loading="lazy">
  <figcaption>
    Views per video as a share of subscriber count, 5th to 95th percentile, from
    <a href="https://growcreator.pro/blog/small-youtube-channel-statistics">360 audited public YouTube channels</a>
    (Grow Creator, 2026)
  </figcaption>
</figure>
If you would rather rebuild either chart yourself from the underlying numbers, the band medians and sample sizes are all in the table above, and the script that derives them is named in the method section.
Cite this: Small YouTube channel statistics, 360 public channels between 1,030 and 75,200 subscribers, Grow Creator audit corpus, 2026. Median lifetime views per video by band: 1K-5K 1,260 (n=137); 5K-10K 2,209 (n=60); 10K-25K 8,219 (n=97); 25K-50K 12,864 (n=62). Views per video as a share of subscribers: 5th percentile 0.1%, median 50.2%, 95th percentile 1,147.5%. Sample skews to India (41.7%); selection is audit-seekers, not random. Method and limits at https://growcreator.pro/blog/small-youtube-channel-statistics
Frequently asked questions
How many views should a small YouTube channel get per video?
Across 360 audited channels, the median lifetime views per video was 1,260 for channels with 1K to 5K subscribers, 2,209 for 5K to 10K, 8,219 for 10K to 25K, and 12,864 for 25K to 50K. The spread within each band is very wide, so treat these as a reference point rather than a target.
Is there a normal views-to-subscriber ratio?
Not in any useful sense. Views per video ranged from 0.1% of subscriber count at the 5th percentile to over 1,147% at the 95th, with a median near 50%. The 5 to 20% band that ranking pages call healthy describes 15.6% of these channels.
Does this data show whether uploading more videos helps?
No, and we will not claim it does. The corpus has no channel-age field, so upload count mostly reflects how long a channel has existed. vidIQ measured the right variable across more than ten million channels, comparing monthly upload rate against monthly growth rate, and found higher cadence tracking faster growth.
Where does this data come from?
Public YouTube Data API fields for 360 channels that were run through a Grow Creator audit: subscriber count, video count, lifetime views and country. No private or logged-in analytics data is involved, and the analysis script is in our repository so the figures can be re-derived.
Can I cite these numbers?
Yes. There is a ready-made citation at the end of the article that carries the sample size, the limits and the source URL. Please keep the caveats attached, particularly the selection bias and the skew toward India, because they change how the numbers should be read.
Canonical: https://growcreator.pro/blog/small-youtube-channel-statistics
Leumos Private Limited · hello@growcreator.pro